Lab · runnable experiments
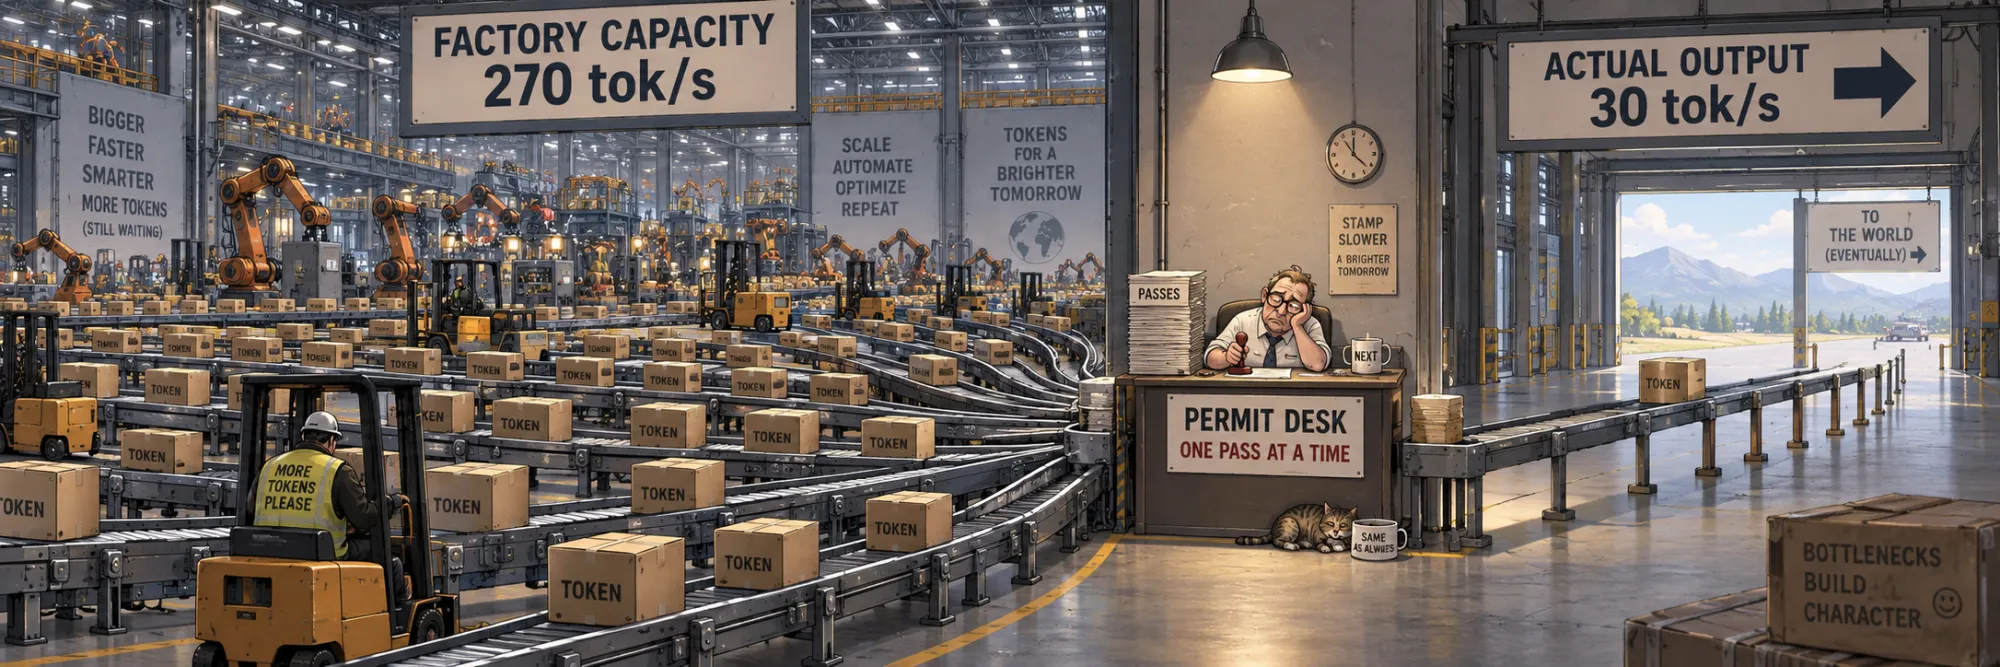
How LLM Inference Actually Works: Where the Time Goes on a Real GPU
Created Sep 17, 2026 Updated Sep 19, 2026
Read the parent noteOne prompt, one model, one stopwatch on every stage between the text going in and the text coming out. Nothing here is simulated: the generation loop is written out by hand, so every step of it can be timed separately, and the timings are checked against what the card can physically do.
Part 1 follows a single request from text to text and records when each stage starts and ends. Part 2 predicts what a decode step should cost from the size of the model in bytes and the measured speed of memory, measures it on two models, and replays the same step as a CUDA graph to see how much of it was the work and how much the handing-out of the work. Part 3 varies the context: the weights stay the same size, the key/value cache does not. Part 4 separates the two waits — the prompt pass before the first token, and the steps after it. Part 5 runs several sequences at once. Part 6 comes last on purpose: it opens a prefill and a decode step with the profiler, which makes every later kernel launch in the process more expensive, so nothing else in the lab is measured after it.
Setup
Run on Kaggle with Settings → Accelerator → GPU T4 x2 (the lab uses one card) and Internet on — the models are downloaded from the Hub.
import os
os.environ.setdefault("CUDA_DEVICE_ORDER", "PCI_BUS_ID")
os.environ.setdefault("TOKENIZERS_PARALLELISM", "false")

import sys, gc, json, time, math, datetime, platform, subprocess, traceback, contextlib
import numpy as np, pandas as pd, torch
import matplotlib.pyplot as plt
from transformers import AutoTokenizer, AutoModelForCausalLM

assert torch.cuda.is_available(), "No GPU: Settings → Accelerator → GPU T4 x2"
DEV = torch.device("cuda:0")
torch.cuda.set_device(DEV)
torch.set_grad_enabled(False)

INK, LINE = "#2a2a2a", "#d9d3c7"
BLUE, EMBER, FOREST, GRAY, PLUM = "#3b6ea5", "#c4521e", "#2e7d5b", "#9a9384", "#7a4f8c"
plt.rcParams.update({"font.size": 9, "axes.edgecolor": LINE, "axes.spines.top": False,
                     "axes.spines.right": False, "figure.dpi": 120})

SMALL, BIG = "Qwen/Qwen2.5-0.5B-Instruct", "Qwen/Qwen2.5-1.5B-Instruct"
RESULTS = {"meta": {}, "errors": {}}


@contextlib.contextmanager
def experiment(name):
    """One experiment per cell. A failure is printed and recorded, and the run moves on."""
    t0 = time.time()
    try:
        yield
    except Exception:
        RESULTS["errors"][name] = traceback.format_exc()
        print(f"!! {name} failed:\n{traceback.format_exc()}")
    finally:
        print(f"[{name}: {time.time() - t0:.1f} s]")


def jsonable(o):
    if isinstance(o, (np.floating, np.integer)):
        return o.item()
    if isinstance(o, np.ndarray):
        return o.tolist()
    if isinstance(o, torch.Size):
        return list(o)
    return str(o)


print("executed:", datetime.date.today().isoformat())
print("torch", torch.__version__, "| CUDA", torch.version.cuda, "|", torch.cuda.get_device_name(0))
executed: 2026-09-18
torch 2.10.0+cu128 | CUDA 12.8 | Tesla T4The stopwatches. wall measures what a caller experiences: it starts the clock, runs the work, and waits for the GPU to finish before stopping it. gpu_time measures the GPU alone, with CUDA events, which is the same number only when the card is the thing being waited on — Part 3 is about the gap between the two.
def wall(fn, iters=10, warmup=3):
    """Median wall-clock seconds of fn(), GPU work included (the caller waits for it)."""
    for _ in range(warmup):
        fn()
    torch.cuda.synchronize()
    ts = []
    for _ in range(iters):
        t0 = time.perf_counter()
        fn()
        torch.cuda.synchronize()
        ts.append(time.perf_counter() - t0)
    return float(np.median(ts))


def gpu_time(fn, iters=10, warmup=3):
    """Median seconds fn() keeps the GPU busy, measured with CUDA events."""
    for _ in range(warmup):
        fn()
    torch.cuda.synchronize()
    s, e = torch.cuda.Event(enable_timing=True), torch.cuda.Event(enable_timing=True)
    ts = []
    for _ in range(iters):
        s.record(); fn(); e.record(); e.synchronize()
        ts.append(s.elapsed_time(e) / 1e3)
    return float(np.median(ts))


def load(name):
    """The model as a server would hold it: half precision, on the GPU, in eval mode."""
    tok = AutoTokenizer.from_pretrained(name)
    try:
        model = AutoModelForCausalLM.from_pretrained(name, dtype=torch.float16, attn_implementation="sdpa")
    except TypeError:                                   # older transformers spell it differently
        model = AutoModelForCausalLM.from_pretrained(name, torch_dtype=torch.float16, attn_implementation="sdpa")
    model = model.to(DEV).eval()
    return tok, model


def weight_bytes(model):
    return sum(p.numel() * p.element_size() for p in model.parameters())


def dims(model):
    c = model.config
    kv_heads = getattr(c, "num_key_value_heads", c.num_attention_heads)
    head_dim = getattr(c, "head_dim", None) or c.hidden_size // c.num_attention_heads
    return {"layers": c.num_hidden_layers, "hidden": c.hidden_size, "inter": c.intermediate_size,
            "heads": c.num_attention_heads, "kv_heads": kv_heads, "head_dim": head_dim,
            "vocab": c.vocab_size, "kv_bytes_per_token": 2 * c.num_hidden_layers * kv_heads * head_dim * 2}


LOADED = {"name": None, "tok": None, "model": None}


def use(name):
    """Load `name` if it is not the model already on the card, and free the previous one."""
    if LOADED["name"] != name:
        LOADED["tok"] = LOADED["model"] = None
        gc.collect(); torch.cuda.empty_cache()
        LOADED["tok"], LOADED["model"] = load(name)
        LOADED["name"] = name
    return LOADED["tok"], LOADED["model"]


def flops_and_bytes(d, n_tokens, context, batch=1):
    """FLOPs and bytes for one forward pass over n_tokens, with `context` tokens already cached."""
    h, inter, L = d["hidden"], d["inter"], d["layers"]
    kv_width = d["kv_heads"] * d["head_dim"]
    per_layer_params = h * (h + 2 * kv_width + h) + 3 * h * inter      # q,k,v,o + gate,up,down
    linear_flops = 2 * batch * n_tokens * (L * per_layer_params + h * d["vocab"])
    # attention: scores and the weighted sum, over the tokens each query can see
    seen = context * n_tokens + n_tokens * (n_tokens + 1) / 2
    attn_flops = 4 * batch * L * d["heads"] * d["head_dim"] * seen
    weight_bytes_ = 2 * (L * per_layer_params + h * d["vocab"])
    kv_bytes = batch * d["kv_bytes_per_token"] * (context + n_tokens)
    return {"flops": linear_flops + attn_flops, "linear_flops": linear_flops, "attn_flops": attn_flops,
            "weight_bytes": weight_bytes_, "kv_bytes": kv_bytes}


def drop(*names):
    """Forget large locals by name and give the memory back to the allocator."""
    for n in names:
        globals().pop(n, None)
    gc.collect(); torch.cuda.empty_cache()
The generation loop itself, written out rather than called. prefill runs the prompt through the model once and returns the first token together with the cache the attention layers filled in; decode_step runs one token through the same weights and appends to that cache. Everything else in this lab calls these two functions.
from transformers import DynamicCache


def fresh_cache():
    return DynamicCache()


def prefill(model, ids, cache=None):
    """The whole prompt, one forward pass. Returns the next token id and the filled cache."""
    cache = fresh_cache() if cache is None else cache
    out = model(input_ids=ids, past_key_values=cache, use_cache=True)
    return out.logits[:, -1].argmax(-1, keepdim=True), out.past_key_values


def decode_step(model, tok_id, cache):
    """One token in, one token out, cache grows by one position."""
    out = model(input_ids=tok_id, past_key_values=cache, use_cache=True)
    return out.logits[:, -1].argmax(-1, keepdim=True), out.past_key_values


def step_times(model, ids, k=12, warmup=4):
    """Median seconds of a decode step at this prompt length, and the same measured on the GPU.

    The cache is never rewound — rewinding it would rebuild tensors and time that instead. The
    context simply grows by one token per step, which over a dozen steps changes nothing measurable.
    """
    nxt, cache = prefill(model, ids)
    for _ in range(warmup):
        nxt, cache = decode_step(model, nxt, cache)
    torch.cuda.synchronize()
    walls, gpus = [], []
    s, e = torch.cuda.Event(enable_timing=True), torch.cuda.Event(enable_timing=True)
    for _ in range(k):
        t0 = time.perf_counter(); s.record()
        nxt, cache = decode_step(model, nxt, cache)
        e.record(); e.synchronize()
        walls.append(time.perf_counter() - t0); gpus.append(s.elapsed_time(e) / 1e3)
    return {"wall_s": float(np.median(walls)), "gpu_s": float(np.median(gpus)),
            "next": nxt, "cache": cache}


def make_ids(tok, n_tokens, batch=1):
    """A prompt of exactly n_tokens real tokens, built from prose rather than random ids."""
    seed = ("A language model answers a question one token at a time. Each token it writes becomes "
            "part of the text it reads for the next one, which is why the work never stops being "
            "sequential. ")
    ids = tok(seed * (n_tokens // 20 + 2), return_tensors="pt").input_ids[:, :n_tokens]
    assert ids.shape[1] == n_tokens, f"prompt too short: {ids.shape[1]} < {n_tokens}"
    return ids.repeat(batch, 1).to(DEV)


def run_request(model, ids, n_new, per_step=True):
    """Prefill plus n_new decode steps. Returns the ids written and the timeline in seconds."""
    torch.cuda.synchronize()
    t0 = time.perf_counter()
    nxt, cache = prefill(model, ids)
    torch.cuda.synchronize()
    t_prefill = time.perf_counter() - t0
    steps, written = [], [nxt]
    for _ in range(n_new - 1):
        t = time.perf_counter()
        nxt, cache = decode_step(model, nxt, cache)
        if per_step:
            torch.cuda.synchronize()
        steps.append(time.perf_counter() - t)
        written.append(nxt)
    if not per_step:
        torch.cuda.synchronize()
    return torch.cat(written, dim=1), {"prefill": t_prefill, "steps": steps}
The attention of a transformer has several implementations behind one call, and not all of them exist on every card. Below, the same 1,024-token prefill is run under each backend PyTorch offers, and the ones this card refuses are recorded as refusals. The fastest one that works is used for the rest of the lab.
with experiment("attention-backend"):
    from torch.nn.attention import sdpa_kernel, SDPBackend
    tok, model = use(SMALL)
    ids = make_ids(tok, 1024)
    backends = {"math": SDPBackend.MATH, "memory-efficient": SDPBackend.EFFICIENT_ATTENTION,
                "flash": SDPBackend.FLASH_ATTENTION}
    if hasattr(SDPBackend, "CUDNN_ATTENTION"):
        backends["cuDNN"] = SDPBackend.CUDNN_ATTENTION
    back_rows = []
    for name, backend in backends.items():
        try:
            with sdpa_kernel([backend]):
                t = wall(lambda: prefill(model, ids), iters=3, warmup=1)
            back_rows.append({"backend": name, "prefill_ms": 1e3 * t, "works": True})
            print(f"{name:16s} prefill of 1,024 tokens: {1e3 * t:7.1f} ms")
        except Exception as exc:
            back_rows.append({"backend": name, "prefill_ms": None, "works": False,
                              "error": type(exc).__name__})
            print(f"{name:16s} refused by this card ({type(exc).__name__})")
    ok = [r for r in back_rows if r["works"]]
    BEST = min(ok, key=lambda r: r["prefill_ms"])["backend"] if ok else "math"
    ATTENTION = sdpa_kernel([backends[BEST]])
    print(f"\nusing the {BEST} backend for everything below")
    RESULTS["attention_backend"] = {"rows": back_rows, "chosen": BEST, "prompt_tokens": 1024}
math prefill of 1,024 tokens: 140.5 ms
memory-efficient refused by this card (RuntimeError)
flash refused by this card (RuntimeError)
cuDNN refused by this card (RuntimeError)
using the math backend for everything below
[attention-backend: 12.0 s]if "ATTENTION" in globals():
ATTENTION.__enter__() # every measurement below runs under the backend chosen above
print("attention backend in force:", RESULTS.get("attention_backend", {}).get("chosen", "PyTorch's own choice"))attention backend in force: mathPart 1 — one request, end to end
A 1,024-token prompt and 32 generated tokens, with a timestamp on every stage: turning text into token ids, the prompt’s single forward pass, each generation step separately, and turning ids back into text. The tokenizer runs on the CPU and the rest on the GPU, so the first and last stages are also a check on how much of the wait is not the model at all.
with experiment("timeline"):
    tok, model = use(SMALL)
    d = dims(model)
    print(f"{SMALL}: {sum(p.numel() for p in model.parameters()) / 1e6:.0f}M parameters, "
          f"{weight_bytes(model) / 2**30:.2f} GiB of weights in fp16, {d['layers']} layers, "
          f"hidden {d['hidden']}, vocabulary {d['vocab']:,}")

    text = ("A language model answers a question one token at a time. " * 90)
    t = time.perf_counter(); enc = tok(text, return_tensors="pt"); t_tok = time.perf_counter() - t
    ids = enc.input_ids[:, :1024].to(DEV)
    print(f"tokenizing {len(text):,} characters took {1e3 * t_tok:.2f} ms → {enc.input_ids.shape[1]} tokens")

    _ = run_request(model, ids, 4)                       # warm the kernels, the allocator and the clocks
    out_ids, tl = run_request(model, ids, 32)
    t = time.perf_counter(); text_out = tok.decode(out_ids[0]); t_detok = time.perf_counter() - t

    steps = np.array(tl["steps"])
    total = t_tok + tl["prefill"] + steps.sum() + t_detok
    print(f"\ntokenize   {1e3 * t_tok:8.2f} ms")
    print(f"prefill    {1e3 * tl['prefill']:8.2f} ms   (1,024 tokens, one forward pass) ← TTFT")
    print(f"decode     {1e3 * steps.sum():8.2f} ms   (31 steps, {1e3 * steps.mean():.2f} ms each) ← TPOT")
    print(f"detokenize {1e3 * t_detok:8.2f} ms")
    print(f"total      {1e3 * total:8.2f} ms for 32 tokens")
    print(f"\nfirst step {1e3 * steps[0]:.2f} ms, median step {1e3 * np.median(steps):.2f} ms, "
          f"slowest {1e3 * steps.max():.2f} ms")
    print("model wrote:", repr(text_out[:120]))

    fig, ax = plt.subplots(figsize=(7, 1.9))
    marks = [("tokenize", t_tok, GRAY), ("prefill", tl["prefill"], BLUE)] + \
            [(None, s, EMBER) for s in steps] + [("detokenize", t_detok, GRAY)]
    x = 0.0
    for label, dur, col in marks:
        ax.barh(0, 1e3 * dur, left=1e3 * x, height=.5, color=col, edgecolor="white", linewidth=.4)
        x += dur
    ax.set_yticks([]); ax.set_xlabel("milliseconds since the request arrived")
    ax.set_title("one request: tokenize · prefill · 31 decode steps · detokenize", fontsize=9)
    plt.tight_layout(); plt.show()

    RESULTS["timeline"] = {"model": SMALL, "prompt_tokens": int(ids.shape[1]), "new_tokens": 32,
                           "tokenize_s": t_tok, "prefill_s": tl["prefill"], "detokenize_s": t_detok,
                           "step_s": steps.tolist(), "chars": len(text),
                           "params": sum(p.numel() for p in model.parameters()),
                           "weight_bytes": weight_bytes(model), "dims": d}
Qwen/Qwen2.5-0.5B-Instruct: 494M parameters, 0.92 GiB of weights in fp16, 24 layers, hidden 896, vocabulary 151,936
tokenizing 5,130 characters took 3.76 ms → 1081 tokens
tokenize 3.76 ms
prefill 136.64 ms (1,024 tokens, one forward pass) ← TTFT
decode 1134.47 ms (31 steps, 36.60 ms each) ← TPOT
detokenize 0.35 ms
total 1275.22 ms for 32 tokens
first step 37.64 ms, median step 36.35 ms, slowest 40.98 ms
model wrote: ' a question one token at a time. A language model answers a question one token at a time. A language model answers a que'
[timeline: 2.0 s]The prompt is 1,024 tokens and the answer is 32. Turning the text into token ids took 3.6 ms, the prompt’s single forward pass 138 ms, and each token after that about 35 ms — so the first token arrived after a seventh of a second and the remaining 31 took a full second between them. Turning ids back into text cost 0.3 ms. Of the 1.24 seconds the request took, 0.3% went on anything other than running the model.
The same request again, this time without waiting for the GPU between steps, and once more through the library’s own generate. The first tells how much of the per-step time is the caller waiting; the second checks that the hand-written loop is not quietly slower than the normal way to run a model.
with experiment("loop-overhead"):
    n_new = 32
    t = time.perf_counter(); run_request(model, ids, n_new, per_step=False); t_free = time.perf_counter() - t
    t = time.perf_counter(); run_request(model, ids, n_new, per_step=True); t_sync = time.perf_counter() - t
    t = time.perf_counter()
    gen = model.generate(ids, max_new_tokens=n_new, do_sample=False, use_cache=True,
                         pad_token_id=tok.eos_token_id)
    torch.cuda.synchronize(); t_gen = time.perf_counter() - t
    print(f"hand-written loop, synchronizing every step: {1e3 * t_sync:.1f} ms")
    print(f"hand-written loop, no per-step wait:         {1e3 * t_free:.1f} ms")
    print(f"transformers .generate():                    {1e3 * t_gen:.1f} ms")
    print(f"same tokens as .generate(): {bool((gen[:, ids.shape[1]:] == out_ids).all())}")
    RESULTS["loop_overhead"] = {"sync_s": t_sync, "free_s": t_free, "generate_s": t_gen, "new_tokens": n_new}
hand-written loop, synchronizing every step: 1155.2 ms
hand-written loop, no per-step wait: 1105.5 ms
transformers .generate(): 1392.2 ms
same tokens as .generate(): True
[loop-overhead: 3.7 s]Waiting for the GPU after every step costs nothing measurable: the loop has nothing else to do with that time. The library’s own generate produces the same 32 tokens and takes about 20% longer, which is the bookkeeping around the loop rather than the loop itself.
Part 2 — what a decode step should cost
A decode step reads every weight of the model once and does two floating-point operations with each. The time that takes cannot be shorter than the time it takes to move those bytes out of memory. Below, the card’s memory speed is measured first, the prediction is written down, and only then are the two models timed against it.
with experiment("bandwidth"):
    buf = torch.empty(1 << 28, device=DEV, dtype=torch.float16)      # 512 MiB
    dst = torch.empty_like(buf)
    t_copy = gpu_time(lambda: dst.copy_(buf), iters=20)
    bw_copy = 2 * buf.numel() * buf.element_size() / t_copy          # read + write
    t_read = gpu_time(lambda: torch.sum(buf), iters=20)
    bw_read = buf.numel() * buf.element_size() / t_read
    BW = max(bw_copy, bw_read)
    print(f"copy   {bw_copy / 1e9:6.1f} GB/s (read + write)")
    print(f"read   {bw_read / 1e9:6.1f} GB/s (reduction)")
    print(f"using {BW / 1e9:.0f} GB/s as this card's usable memory speed")
    del buf, dst
    gc.collect(); torch.cuda.empty_cache()
    RESULTS["bandwidth"] = {"copy_gbs": bw_copy / 1e9, "read_gbs": bw_read / 1e9, "used_gbs": BW / 1e9}
copy 233.1 GB/s (read + write)
read 273.7 GB/s (reduction)
using 274 GB/s as this card's usable memory speed
[bandwidth: 0.4 s]Reading is the honest number for a decode step, which reads weights and writes almost nothing: 273 GB/s, against the 320 GB/s on this card’s datasheet.
with experiment("prediction"):
    rows = []
    drop("cache", "nxt", "st")
    for name in (SMALL, BIG):
        tok, model = use(name)
        dd = dims(model)
        wb = weight_bytes(model)
        ids_1k = make_ids(tok, 1024)
        st_ = step_times(model, ids_1k)
        kv = dd["kv_bytes_per_token"] * 1024
        predicted = (wb + kv) / BW
        rows.append({"model": name.split("/")[-1], "params": sum(p.numel() for p in model.parameters()),
                     "weight_GiB": wb / 2**30, "kv_MiB": kv / 2**20,
                     "predicted_ms": 1e3 * predicted, "step_ms": 1e3 * st_["wall_s"],
                     "gpu_span_ms": 1e3 * st_["gpu_s"],
                     "achieved_GBs": (wb + kv) / st_["wall_s"] / 1e9,
                     "tokens_per_s": 1 / st_["wall_s"]})
        print(f"{rows[-1]['model']}: weights {wb / 2**30:.2f} GiB + cache {kv / 2**20:.0f} MiB → "
              f"the bytes say {1e3 * predicted:.2f} ms, the step takes {1e3 * st_['wall_s']:.2f} ms "
              f"({(wb + kv) / st_['wall_s'] / 1e9:.0f} GB/s of the {BW / 1e9:.0f} the card can do)")
        del st_, ids_1k
        gc.collect(); torch.cuda.empty_cache()
    pred = pd.DataFrame(rows)
    print()
    print(pred.to_string(index=False, float_format=lambda v: f"{v:.2f}"))
    RESULTS["prediction"] = {"rows": rows, "bandwidth_gbs": BW / 1e9, "context": 1024}
Qwen2.5-0.5B-Instruct: weights 0.92 GiB + cache 12 MiB → the bytes say 3.66 ms, the step takes 32.75 ms (31 GB/s of the 274 the card can do)Qwen2.5-1.5B-Instruct: weights 2.88 GiB + cache 28 MiB → the bytes say 11.39 ms, the step takes 49.67 ms (63 GB/s of the 274 the card can do)
model params weight_GiB kv_MiB predicted_ms step_ms gpu_span_ms achieved_GBs tokens_per_s
Qwen2.5-0.5B-Instruct 494032768 0.92 12.00 3.66 32.75 32.72 30.56 30.54
Qwen2.5-1.5B-Instruct 1543714304 2.88 28.00 11.39 49.67 49.63 62.75 20.13
[prediction: 21.5 s]Neither model comes close to the prediction. The 0.5-billion one should need 3.7 ms to pull its weights past the arithmetic units and takes 33 ms — 30 GB/s, a ninth of what the card can do. The larger model is closer at 74 GB/s, and the two rows side by side say why: the bytes that have to move triple while the step costs about the same.
The gap between the time the kernels actually run and the time the step takes is thousands of launches, each one submitted from Python. CUDA graphs remove that submission: the whole step is recorded once and replayed as a single unit. If the gap is launch overhead, replaying the graph closes it.
with experiment("cuda-graphs"):
    from transformers import StaticCache
    graph_rows = []
    for name in (SMALL, BIG):
        tok, model = use(name)
        wb = weight_bytes(model)
        kv = dims(model)["kv_bytes_per_token"] * 1024
        ids_1k = make_ids(tok, 1024)
        try:                                          # the constructor lost its device/dtype arguments
            static = StaticCache(config=model.config, max_cache_len=1152)
        except TypeError:
            static = StaticCache(config=model.config, max_batch_size=1, max_cache_len=1152,
                                 device=DEV, dtype=torch.float16)
        out = model(input_ids=ids_1k, past_key_values=static, use_cache=True,
                    cache_position=torch.arange(1024, device=DEV))
        tok_in = out.logits[:, -1].argmax(-1, keepdim=True).clone()
        pos = torch.tensor([1024], device=DEV)

        def step():
            return model(input_ids=tok_in, past_key_values=static, use_cache=True, cache_position=pos).logits

        for _ in range(3):
            step()
        torch.cuda.synchronize()
        eager_ms = 1e3 * wall(step)

        g = torch.cuda.CUDAGraph()
        side = torch.cuda.Stream()
        side.wait_stream(torch.cuda.current_stream())
        with torch.cuda.stream(side):
            for _ in range(3):
                step()
        torch.cuda.current_stream().wait_stream(side)
        with torch.cuda.graph(g):
            static_out = step()
        graph_ms = 1e3 * wall(lambda: g.replay())
        graph_rows.append({"model": name.split("/")[-1], "eager_ms": eager_ms, "graph_ms": graph_ms,
                           "predicted_ms": 1e3 * (wb + kv) / BW,
                           "graph_GBs": (wb + kv) / (graph_ms / 1e3) / 1e9})
        print(f"{graph_rows[-1]['model']}: step by step {eager_ms:.2f} ms · replayed as one graph "
              f"{graph_ms:.2f} ms · the bytes alone say {1e3 * (wb + kv) / BW:.2f} ms")
        del g, static, static_out, ids_1k, out
        gc.collect(); torch.cuda.empty_cache()
    print()
    print(pd.DataFrame(graph_rows).to_string(index=False, float_format=lambda v: f"{v:.2f}"))
    RESULTS["cuda_graphs"] = {"rows": graph_rows, "context": 1024, "bandwidth_gbs": BW / 1e9}
Qwen2.5-0.5B-Instruct: step by step 38.97 ms · replayed as one graph 13.07 ms · the bytes alone say 3.66 msQwen2.5-1.5B-Instruct: step by step 41.60 ms · replayed as one graph 25.95 ms · the bytes alone say 11.39 ms
model eager_ms graph_ms predicted_ms graph_GBs
Qwen2.5-0.5B-Instruct 38.97 13.07 3.66 76.54
Qwen2.5-1.5B-Instruct 41.60 25.95 11.39 120.11
[cuda-graphs: 10.6 s]Replaying the step as a graph makes it two to three times faster without changing a single kernel: 36.9 → 12.6 ms for the small model, 40.9 → 26.2 ms for the larger one. What the graph removes is the submission of 1,415 kernels one at a time. What is left is close to the bytes: the larger model now moves 119 GB/s.
Part 3 — the part that grows: the key/value cache
The weights are the same size at every step. The cache is not: every token generated adds its keys and values to what attention has to read next time. Below, the cost of a decode step is measured at contexts from 128 to 8,192 tokens, on both models, with the cache size at each point computed from the model’s own shape.
with experiment("context-sweep"):
    CTX = [128, 512, 1024, 2048, 4096, 8192]
    ctx_rows = []
    for name in (SMALL, BIG):
        tok, model = use(name)
        dd, wb = dims(model), weight_bytes(model)
        for n in CTX:
            ids_n = make_ids(tok, n)
            st_ = step_times(model, ids_n, k=8, warmup=3)
            kv = dd["kv_bytes_per_token"] * n
            ctx_rows.append({"model": name.split("/")[-1], "context": n, "gpu_ms": 1e3 * st_["gpu_s"],
                             "wall_ms": 1e3 * st_["wall_s"],
                             "kv_MiB": kv / 2**20, "weight_GiB": wb / 2**30,
                             "bytes_per_step_MiB": (wb + kv) / 2**20,
                             "predicted_ms": 1e3 * (wb + kv) / BW})
            del st_, ids_n
            gc.collect(); torch.cuda.empty_cache()
        print(pd.DataFrame([r for r in ctx_rows if r["model"] == name.split("/")[-1]]).to_string(
            index=False, float_format=lambda v: f"{v:.2f}"))
    cs = pd.DataFrame(ctx_rows)

    fig, ax = plt.subplots(figsize=(6, 3.2))
    for (m, g_), col in zip(cs.groupby("model"), (BLUE, EMBER)):
        ax.plot(g_.context, g_.gpu_ms, "o-", color=col, label=m)
        ax.plot(g_.context, g_.predicted_ms, "--", color=col, alpha=.5)
    ax.set_xscale("log", base=2); ax.set_xlabel("tokens already in the context")
    ax.set_ylabel("one decode step, ms"); ax.legend(frameon=False)
    ax.set_title("solid: measured · dashed: bytes to move ÷ memory speed", fontsize=9)
    plt.tight_layout(); plt.show()
    RESULTS["context_sweep"] = {"rows": ctx_rows}
model context gpu_ms wall_ms kv_MiB weight_GiB bytes_per_step_MiB predicted_ms
Qwen2.5-0.5B-Instruct 128 33.45 33.48 1.50 0.92 943.79 3.62
Qwen2.5-0.5B-Instruct 512 33.35 33.39 6.00 0.92 948.29 3.63
Qwen2.5-0.5B-Instruct 1024 32.80 32.83 12.00 0.92 954.29 3.66
Qwen2.5-0.5B-Instruct 2048 32.87 32.90 24.00 0.92 966.29 3.70
Qwen2.5-0.5B-Instruct 4096 33.98 34.00 48.00 0.92 990.29 3.79
Qwen2.5-0.5B-Instruct 8192 34.40 34.43 96.00 0.92 1038.29 3.98 model context gpu_ms wall_ms kv_MiB weight_GiB bytes_per_step_MiB predicted_ms
Qwen2.5-1.5B-Instruct 128 39.60 39.62 3.50 2.88 2947.90 11.30
Qwen2.5-1.5B-Instruct 512 39.58 39.60 14.00 2.88 2958.40 11.34
Qwen2.5-1.5B-Instruct 1024 39.13 39.16 28.00 2.88 2972.40 11.39
Qwen2.5-1.5B-Instruct 2048 38.77 38.79 56.00 2.88 3000.40 11.50
Qwen2.5-1.5B-Instruct 4096 44.11 44.14 112.00 2.88 3056.40 11.71
Qwen2.5-1.5B-Instruct 8192 71.22 71.25 224.00 2.88 3168.40 12.14
[context-sweep: 35.5 s]The prediction rises with context, because the cache grows; the measurement does not follow it. For the small model the step is flat from 128 to 8,192 tokens — the cache is 96 MiB against 940 MiB of weights, and both are hidden behind the cost of launching the work. The larger model is flat to 4,096 and then jumps by 60% at 8,192, which is more than its extra bytes can explain.
A long generation from a short prompt measures the same thing from the other side: nothing about the request changes except that the model’s own output keeps being added to the context.
with experiment("long-generation"):
    tok, model = use(SMALL)
    ids_short = make_ids(tok, 32)
    _ = run_request(model, ids_short, 8)
    _, tl_long = run_request(model, ids_short, 1024)
    st = np.array(tl_long["steps"])
    k = 32
    binned = st[: len(st) // k * k].reshape(-1, k).mean(1)
    print(f"first 32 steps {1e3 * st[:32].mean():.2f} ms · last 32 steps {1e3 * st[-32:].mean():.2f} ms "
          f"({100 * (st[-32:].mean() / st[:32].mean() - 1):+.1f}%)")
    fig, ax = plt.subplots(figsize=(6, 2.8))
    ax.plot(np.arange(len(binned)) * k + 32, 1e3 * binned, color=EMBER, lw=1.2)
    ax.set_xlabel("tokens generated so far"); ax.set_ylabel("ms per token (mean of 32)")
    plt.tight_layout(); plt.show()
    RESULTS["long_generation"] = {"model": SMALL, "prompt_tokens": 32, "steps_s": st.tolist(),
                                  "bin": k, "binned_s": binned.tolist()}
first 32 steps 33.11 ms · last 32 steps 32.38 ms (-2.2%)
[long-generation: 36.8 s]A thousand tokens of generation, and the last thirty-two cost what the first thirty-two cost. At this model size and this context length, the growth of the cache is not what a user feels.
Part 4 — the two waits
The wait before anything appears and the wait between tokens are set by different things. First, the prompt is varied with the output held at a single token, which isolates the first wait. Then the prompt is held fixed and the output length varied, which leaves the first wait alone and moves everything after it.
with experiment("ttft-vs-prompt"):
    tok, model = use(SMALL)
    PROMPTS = [16, 64, 128, 256, 512, 1024, 2048, 4096, 8192]
    ttft_rows = []
    for n in PROMPTS:
        ids_n = make_ids(tok, n)
        t = wall(lambda: prefill(model, ids_n), iters=5, warmup=2)
        work = flops_and_bytes(d, n, 0)
        ttft_rows.append({"prompt": n, "ttft_ms": 1e3 * t, "TFLOPs": work["flops"] / t / 1e12,
                          "ms_per_token": 1e3 * t / n})
    tt = pd.DataFrame(ttft_rows)
    print(tt.to_string(index=False, float_format=lambda v: f"{v:.3f}"))
    fig, axes = plt.subplots(1, 2, figsize=(7, 2.8))
    axes[0].plot(tt.prompt, tt.ttft_ms, "o-", color=BLUE)
    axes[0].set_xlabel("prompt tokens"); axes[0].set_ylabel("time to first token, ms")
    axes[1].plot(tt.prompt, tt.TFLOPs, "o-", color=FOREST)
    axes[1].set_xlabel("prompt tokens"); axes[1].set_ylabel("TFLOP/s reached")
    for a in axes:
        a.set_xscale("log", base=2)
    plt.tight_layout(); plt.show()
    RESULTS["ttft_vs_prompt"] = {"model": SMALL, "rows": ttft_rows}
prompt ttft_ms TFLOPs ms_per_token
16 36.398 0.435 2.275
64 36.232 1.750 0.566
128 35.755 3.557 0.279
256 37.048 6.903 0.145
512 57.032 9.067 0.111
1024 150.977 7.000 0.147
2048 468.294 4.706 0.229
4096 1677.148 2.843 0.409
8192 7173.076 1.531 0.876
[ttft-vs-prompt: 67.7 s]Below 512 tokens of prompt the wait barely moves: 35 ms for 16 tokens, 37 ms for 256. The card is nowhere near busy, and the time is the same fixed cost a decode step pays. From there the prompt starts to cost what it should and then more: 165 ms at 1,024 tokens, 7.7 seconds at 8,192. The rate says it from the other side — 8.9 TFLOP/s around 512 tokens, down to 1.4 by 8,192, because attention on this card materializes the whole score matrix.
with experiment("output-length"):
    tok, model = use(SMALL)
    OUT = [1, 8, 32, 128, 512]
    ids_1k = make_ids(tok, 1024)
    out_rows = []
    for n_new in OUT:
        torch.cuda.synchronize(); t0 = time.perf_counter()
        _, tl_ = run_request(model, ids_1k, n_new)
        total = time.perf_counter() - t0
        steps_ = np.array(tl_["steps"]) if tl_["steps"] else np.array([np.nan])
        out_rows.append({"new_tokens": n_new, "ttft_ms": 1e3 * tl_["prefill"], "total_ms": 1e3 * total,
                         "tpot_ms": (1e3 * steps_.mean()) if tl_["steps"] else None,
                         "tokens_per_s": n_new / total})
    ol = pd.DataFrame(out_rows)
    print(ol.to_string(index=False, float_format=lambda v: f"{v:.2f}"))
    RESULTS["output_length"] = {"model": SMALL, "prompt_tokens": 1024, "rows": out_rows}
new_tokens ttft_ms total_ms tpot_ms tokens_per_s
1 153.66 153.81 NaN 6.50
8 169.13 404.88 33.66 19.76
32 153.35 1167.55 32.71 27.41
128 155.26 4392.39 33.36 29.14
512 151.97 17071.42 33.10 29.99
[output-length: 23.2 s]The first wait does not move: 148 to 173 ms whether the answer is one token or five hundred. Everything after it is the number of tokens times the cost of a token.
Part 5 — more than one sequence at a time
Nothing above changes if a second request is on the card: the weights are read once per step whether one sequence or thirty-two are waiting for them. Below, the same 512-token prompt is run at batch sizes from 1 to 32 — the cost per step, the tokens per second in total, and what each sequence sees on its own.
with experiment("batch-sweep"):
    BATCH = [1, 2, 4, 8, 16, 32, 64]
    b_rows = []
    tok, model = use(SMALL)
    dd, wb = dims(model), weight_bytes(model)
    for b in BATCH:
        ids_b = make_ids(tok, 512, batch=b)
        st_ = step_times(model, ids_b, k=8, warmup=3)
        step = st_["wall_s"]
        kv = b * dd["kv_bytes_per_token"] * 512
        work = flops_and_bytes(dd, 1, 512, batch=b)
        b_rows.append({"batch": b, "step_ms": 1e3 * step, "tokens_per_s": b / step,
                       "per_seq_tokens_per_s": 1 / step, "GB_s": (wb + kv) / step / 1e9,
                       "TFLOPs": work["flops"] / step / 1e12, "kv_MiB": kv / 2**20})
        del st_, ids_b
        gc.collect(); torch.cuda.empty_cache()
    bs = pd.DataFrame(b_rows)
    print(bs.to_string(index=False, float_format=lambda v: f"{v:.2f}"))
    fig, ax = plt.subplots(figsize=(6, 3))
    ax.plot(bs.batch, bs.tokens_per_s, "o-", color=FOREST, label="tokens/s, all sequences")
    ax.plot(bs.batch, bs.per_seq_tokens_per_s, "o-", color=EMBER, label="tokens/s, one sequence")
    ax.set_xscale("log", base=2); ax.set_yscale("log")
    ax.set_xlabel("sequences generating at once"); ax.set_ylabel("tokens per second")
    ax.legend(frameon=False); plt.tight_layout(); plt.show()
    RESULTS["batch_sweep"] = {"model": SMALL, "prompt_tokens": 512, "rows": b_rows,
                              "weight_bytes": wb, "dims": dd}
batch step_ms tokens_per_s per_seq_tokens_per_s GB_s TFLOPs kv_MiB
1 33.82 29.57 29.57 29.40 0.03 6.00
2 32.02 62.46 31.23 31.25 0.06 12.00
4 33.70 118.69 29.67 30.06 0.12 24.00
8 32.54 245.83 30.73 31.91 0.25 48.00
16 35.99 444.61 27.79 30.25 0.46 96.00
32 55.01 581.68 18.18 21.62 0.60 192.00
64 100.44 637.22 9.96 13.85 0.66 384.00
[batch-sweep: 12.9 s]Up to sixteen sequences the step costs what it cost for one — 33 ms — and every sequence still gets a token every 33 ms, while the total rises from 31 tokens per second to 486. At 32 sequences the step lengthens to 56 ms, at 64 to 106 ms: the individual rate collapses from 30 tokens per second to 9 and the total barely improves, 573 then 603.
Part 6 — inside a prefill and inside a decode step
This part runs last, and that is not an accident. Attaching a profiler to a CUDA process makes every kernel launch a little more expensive for the rest of that process’s life, and a decode step at batch 1 is thousands of launches — so profiling first would have quietly taxed every measurement above. The first cell measures that tax instead of assuming it.
The same weights, twice, with the profiler on: once for the 1,024-token prompt and once for a single token. Every CUDA kernel is attributed to the part of the model it belongs to by the shape of its inputs — the four projections of attention, the three of the MLP, the attention itself, the final matrix into the vocabulary — so the two passes can be compared work by work rather than as two totals.
def profile_pass(fn, warmup=3):
    """GPU time of one call, split two ways: by the operation that asked for it (`ops`, each
    millisecond counted once, with the shapes that say which part of the model it is), and by the
    kernels that ran (`kernels`, which is what the launch count means)."""
    from torch.profiler import profile, ProfilerActivity
    for _ in range(warmup):
        fn()
    torch.cuda.synchronize()
    with profile(activities=[ProfilerActivity.CPU, ProfilerActivity.CUDA], record_shapes=True) as prof:
        fn()
        torch.cuda.synchronize()
    ops, kernels = [], []
    for ev in prof.key_averages(group_by_input_shape=True):
        us = getattr(ev, "self_device_time_total", 0.0) or 0.0
        if us <= 0:
            continue
        row = {"op": ev.key, "shapes": str(ev.input_shapes), "calls": ev.count, "cuda_ms": us / 1e3}
        (ops if ev.key.startswith("aten::") or ev.key.startswith("cudaLaunch") else kernels).append(row)
    ops = pd.DataFrame(ops).sort_values("cuda_ms", ascending=False)
    kern = pd.DataFrame(kernels).sort_values("cuda_ms", ascending=False)
    return ops, kern


def role_of(op, shapes, d):
    """Name the part of the model an operation belongs to, from its name and the widths it works on."""
    try:
        dims_ = [x for x in json.loads(shapes) if x]
    except Exception:
        dims_ = []
    nums = {n for shape in dims_ for n in shape}
    rank = max((len(x) for x in dims_), default=0)
    kv_width = d["kv_heads"] * d["head_dim"]
    if op.startswith(("aten::mm", "aten::addmm", "aten::linear", "aten::matmul")):
        if d["vocab"] in nums:
            return "vocabulary head"
        if d["inter"] in nums:
            return "MLP projections"
        return "attention projections"
    if op.startswith("aten::bmm") or "scaled_dot_product" in op:
        return "attention scores"
    if op.startswith(("aten::_softmax", "aten::softmax", "aten::where", "aten::isneginf", "aten::all",
                      "aten::masked_fill", "aten::logical", "aten::eq", "aten::any")) or (rank == 4 and op.startswith(("aten::add", "aten::copy_", "aten::expand", "aten::to"))):
        return "mask and softmax"
    if op.startswith(("aten::mean", "aten::rsqrt", "aten::pow", "aten::rms_norm", "aten::silu", "aten::sigmoid")):
        return "norms and activations"
    if op.startswith(("aten::cat", "aten::index", "aten::slice", "aten::narrow")) or rank == 5 \
            or (op.startswith("aten::copy_") and (kv_width in nums or d["kv_heads"] in nums)):
        return "cache and the keys it repeats"
    if rank == 4 or d["head_dim"] in nums:
        return "rotary and reshapes"
    return "everything else"
The tax itself, measured before anything else in this part runs:
with experiment("profiler-tax"):
    tok, model = use(SMALL)
    ids = make_ids(tok, 1024)
    before = step_times(model, ids, k=10)
    _ = profile_pass(lambda: decode_step(model, before["next"], before["cache"]))
    after = step_times(model, ids, k=10)
    print(f"a decode step before the profiler has ever run: {1e3 * before['wall_s']:.2f} ms")
    print(f"the same step after one profiled call:          {1e3 * after['wall_s']:.2f} ms "
          f"({100 * (after['wall_s'] / before['wall_s'] - 1):+.1f}%)")
    RESULTS["profiler_tax"] = {"before_s": before["wall_s"], "after_s": after["wall_s"], "model": SMALL}
    drop("before", "after")
a decode step before the profiler has ever run: 32.97 ms
the same step after one profiled call: 39.54 ms (+19.9%)
[profiler-tax: 2.4 s]One profiled call makes every later step 22% slower, for the rest of the process. The step is thousands of launches, and a profiler makes every launch a little more expensive.
With that established, the two passes side by side:
with experiment("inside-a-step"):
    st = step_times(model, ids)
    nxt, cache = st["next"], st["cache"]
    ops_pre, kern_pre = profile_pass(lambda: prefill(model, ids))
    ops_dec, kern_dec = profile_pass(lambda: decode_step(model, nxt, cache))

    parts = {}
    for name, ops, kern in (("prefill", ops_pre, kern_pre), ("decode", ops_dec, kern_dec)):
        ops = ops.copy()
        ops["role"] = [role_of(o, sh, d) for o, sh in zip(ops.op, ops.shapes)]
        by_role = ops.groupby("role")[["cuda_ms", "calls"]].sum().sort_values("cuda_ms", ascending=False)
        by_role["share"] = by_role.cuda_ms / by_role.cuda_ms.sum()
        parts[name] = {"total_cuda_ms": float(ops.cuda_ms.sum()), "kernels": int(kern.calls.sum()),
                       "by_role": by_role.reset_index().to_dict("records"),
                       "top_ops": ops.head(12).to_dict("records"),
                       "top_kernels": kern.head(8).to_dict("records")}
        print(f"\n{name}: {ops.cuda_ms.sum():.2f} ms of GPU work in {int(kern.calls.sum()):,} kernel launches")
        print(by_role.to_string(float_format=lambda v: f"{v:.4f}"))
    RESULTS["inside_a_step"] = parts
    busy = {}
    for name in (SMALL, BIG):
        tok_, model_ = use(name)
        ids_ = make_ids(tok_, 1024)
        st_ = step_times(model_, ids_, k=6, warmup=2)
        ops_, kern_ = profile_pass(lambda: decode_step(model_, st_["next"], st_["cache"]))
        busy[name.split("/")[-1]] = {"busy_ms": float(ops_.cuda_ms.sum()), "kernels": int(kern_.calls.sum()),
                                     "step_ms": 1e3 * st_["wall_s"]}
        print(f"\n{name.split('/')[-1]}: kernels run for {ops_.cuda_ms.sum():.2f} ms, "
              f"launched {int(kern_.calls.sum()):,} times")
        del st_, ids_, ops_, kern_
        gc.collect(); torch.cuda.empty_cache()
    RESULTS["busy"] = busy
    tok, model = use(SMALL)
    ids = make_ids(tok, 1024)
prefill: 159.81 ms of GPU work in 1,535 kernel launches
                               cuda_ms  calls  share
role
mask and softmax               62.9001    360 0.3936
attention scores               32.7222     49 0.2048
MLP projections                26.7877     72 0.1676
vocabulary head                10.9292      1 0.0684
everything else                 9.6435    441 0.0603
attention projections           6.2516     96 0.0391
norms and activations           4.0715    171 0.0255
rotary and reshapes             3.6745    198 0.0230
cache and the keys it repeats   2.8258    145 0.0177

decode: 9.82 ms of GPU work in 1,415 kernel launches
                               cuda_ms  calls  share
role
MLP projections                 2.9897     72 0.3046
vocabulary head                 1.3317      1 0.1357
rotary and reshapes             1.1129    198 0.1134
cache and the keys it repeats   1.0264    146 0.1046
attention scores                0.8383     49 0.0854
attention projections           0.7543     96 0.0768
mask and softmax                0.7050    264 0.0718
everything else                 0.6371    344 0.0649
norms and activations           0.4204    171 0.0428

Qwen2.5-0.5B-Instruct: kernels run for 10.38 ms, launched 1,415 times
Qwen2.5-1.5B-Instruct: kernels run for 21.35 ms, launched 1,647 times[inside-a-step: 13.4 s]Prefill spends its time where the arithmetic is: 27% in the attention projections and the attention itself, 19% in the MLP. Decode spends 10.5 ms of GPU time across 1,415 launches, and its largest single item is the MLP at 29%, followed by the matrix into the vocabulary at 13% — one matrix-vector product carrying 28% of the model’s weights.
How much arithmetic each of those passes actually does, and how much memory it has to move to do it. The counts are analytic — every matrix multiplication in the model, counted once — so they can be divided by the measured times to give the achieved rates.
with experiment("rates"):
    pre = flops_and_bytes(d, 1024, 0)
    dec = flops_and_bytes(d, 1, 1024)
    t_pre = gpu_time(lambda: prefill(model, ids))
    t_dec = st["gpu_s"]
    for name, work, t in (("prefill (1,024 tokens)", pre, t_pre), ("decode (1 token)", dec, t_dec)):
        print(f"{name:24s} {1e3 * t:7.2f} ms   {work['flops'] / t / 1e12:6.2f} TFLOP/s   "
              f"{(work['weight_bytes'] + work['kv_bytes']) / t / 1e9:7.1f} GB/s   "
              f"intensity {work['flops'] / (work['weight_bytes'] + work['kv_bytes']):7.1f} FLOP/B")
    RESULTS["rates"] = {"prefill": {**pre, "gpu_s": t_pre}, "decode": {**dec, "gpu_s": t_dec},
                        "prompt_tokens": 1024}
prefill (1,024 tokens) 170.04 ms 6.21 TFLOP/s 5.9 GB/s intensity 1056.2 FLOP/B
decode (1 token) 39.17 ms 0.03 TFLOP/s 25.5 GB/s intensity 1.1 FLOP/B
[rates: 2.2 s]The last matrix in the model is the one nobody draws: hidden state times the whole vocabulary. At a single token it is one matrix-vector product against a matrix bigger than several transformer layers put together. Below, that projection and the sampling that follows it are timed on their own against the rest of the step.
with experiment("head-and-sampling"):
    tok, model = use(SMALL)
    h_state = torch.randn(1, 1, d["hidden"], device=DEV, dtype=torch.float16)
    head = model.get_output_embeddings()
    t_head = gpu_time(lambda: head(h_state))
    logits = head(h_state).float()
    t_greedy = gpu_time(lambda: logits.argmax(-1))
    def sample():
        p = torch.softmax(logits[0, -1] / 0.7, dim=-1)
        return torch.multinomial(p, 1)
    t_sample = gpu_time(sample)
    head_params = sum(p.numel() for p in head.parameters())
    print(f"vocabulary head: {head_params / 1e6:.0f}M parameters "
          f"({100 * head_params * 2 / weight_bytes(model):.0f}% of the weights), {1e3 * t_head:.3f} ms per token")
    print(f"greedy pick: {1e3 * t_greedy:.3f} ms · sampling with temperature: {1e3 * t_sample:.3f} ms")
    print(f"the whole decode step: {1e3 * t_dec:.3f} ms")
    RESULTS["head_and_sampling"] = {"head_params": head_params, "head_s": t_head, "greedy_s": t_greedy,
                                    "sample_s": t_sample, "step_s": t_dec}
vocabulary head: 136M parameters (28% of the weights), 1.383 ms per token
greedy pick: 0.039 ms · sampling with temperature: 0.322 ms
the whole decode step: 39.166 ms
[head-and-sampling: 0.1 s]The same step, twice: a rested card and a working one
A GPU is slower when it is hot and busy than when it is idle and cool, and a serving card is never idle. Below, the same decode step is timed on a rested card and again after a minute of uninterrupted decoding, with the clock and the power draw read at both points.
def smi(fields="clocks.sm,clocks.mem,power.draw,temperature.gpu"):
    out = subprocess.run(["nvidia-smi", "-i", "0", f"--query-gpu={fields}",
                          "--format=csv,noheader,nounits"], capture_output=True, text=True).stdout
    vals = {}
    for key, val in zip(fields.split(","), (v.strip() for v in out.strip().split(","))):
        try:
            vals[key] = float(val)
        except ValueError:
            vals[key] = val
    return vals


with experiment("clocks"):
    tok, model = use(SMALL)
    ids_1k = make_ids(tok, 1024)
    time.sleep(45)                                   # let the card cool and drop to its idle clock
    idle = smi()
    rested = step_times(model, ids_1k, k=8, warmup=2)
    after_rest = smi()
    t_end = time.time() + 60                         # a minute of nothing but decoding
    nxt_, cache_ = prefill(model, ids_1k)
    while time.time() < t_end:
        for _ in range(20):
            nxt_, cache_ = decode_step(model, nxt_, cache_)
        torch.cuda.synchronize()
    loaded = smi()
    working = step_times(model, ids_1k, k=8, warmup=2)
    print(f"idle card:      {idle['clocks.sm']:.0f} MHz, {idle['power.draw']:.0f} W, {idle['temperature.gpu']:.0f} °C")
    print(f"rested step:    {1e3 * rested['wall_s']:.2f} ms   (card at {after_rest['clocks.sm']:.0f} MHz, "
          f"{after_rest['power.draw']:.0f} W, {after_rest['temperature.gpu']:.0f} °C)")
    print(f"after a minute: {1e3 * working['wall_s']:.2f} ms   (card at {loaded['clocks.sm']:.0f} MHz, "
          f"{loaded['power.draw']:.0f} W, {loaded['temperature.gpu']:.0f} °C)")
    print(f"the same work costs {100 * (working['wall_s'] / rested['wall_s'] - 1):+.1f}% once the card has settled")
    RESULTS["clocks"] = {"idle": idle, "after_rest": after_rest, "loaded": loaded,
                         "rested_s": rested["wall_s"], "working_s": working["wall_s"],
                         "model": SMALL, "context": 1024}
    del nxt_, cache_, rested, working, ids_1k
    gc.collect(); torch.cuda.empty_cache()
idle card: 585 MHz, 34 W, 76 °C
rested step: 38.54 ms (card at 1200 MHz, 45 W, 76 °C)
after a minute: 39.79 ms (card at 1380 MHz, 46 W, 76 °C)
the same work costs +3.3% once the card has settled
[clocks: 107.1 s]What the numbers say
with experiment("summary"):
    tl_ = RESULTS.get("timeline", {})
    pr = pd.DataFrame(RESULTS.get("prediction", {}).get("rows", []))
    if tl_:
        st = np.array(tl_["step_s"])
        print(f"one request: {1e3 * tl_['tokenize_s']:.2f} ms tokenizing, "
              f"{1e3 * tl_['prefill_s']:.1f} ms of prefill, {1e3 * st.mean():.2f} ms per token after that")
    if not pr.empty:
        for _, r in pr.iterrows():
            b = RESULTS.get("busy", {}).get(r["model"], {})
            g = next((x for x in RESULTS.get("cuda_graphs", {}).get("rows", []) if x["model"] == r["model"]), {})
            print(f"{r['model']}: the bytes say {r['predicted_ms']:.2f} ms per token, the step takes "
                  f"{r['step_ms']:.2f} ms, its kernels run for {b.get('busy_ms', float('nan')):.2f} ms, "
                  f"and replayed as one graph it takes {g.get('graph_ms', float('nan')):.2f} ms")
    print("\nerrors:", list(RESULTS["errors"]) or "none")
one request: 3.76 ms tokenizing, 136.6 ms of prefill, 36.60 ms per token after that
Qwen2.5-0.5B-Instruct: the bytes say 3.66 ms per token, the step takes 32.75 ms, its kernels run for 10.38 ms, and replayed as one graph it takes 13.07 ms
Qwen2.5-1.5B-Instruct: the bytes say 11.39 ms per token, the step takes 49.67 ms, its kernels run for 21.35 ms, and replayed as one graph it takes 25.95 ms
errors: none
[summary: 0.0 s]RESULTS["meta"].update(
executed=datetime.datetime.now(datetime.timezone.utc).isoformat(timespec="seconds"),
torch=torch.__version__, cuda=torch.version.cuda, gpu=torch.cuda.get_device_name(0),
python=platform.python_version(), kaggle=bool(os.environ.get("KAGGLE_KERNEL_RUN_TYPE")),
)
out_dir = "/kaggle/working" if os.path.isdir("/kaggle/working") else "."
with open(os.path.join(out_dir, "inference_results.json"), "w") as f:
json.dump(RESULTS, f, default=jsonable, indent=1)
print("saved", os.path.join(out_dir, "inference_results.json"))saved /kaggle/working/inference_results.json